sciware
Sciware
Finding Where Your Code Spends Time
Performance Troubleshooting and Profiling
https://github.com/flatironinstitute/sciware/tree/main/19_Profiling
Rules of Engagement
Goal:
Activities where participants all actively work to foster an environment which encourages participation across experience levels, coding language fluency, technology choices*, and scientific disciplines.
*though sometimes we try to expand your options
Rules of Engagement
- Avoid discussions between a few people on a narrow topic
- Provide time for people who haven’t spoken to speak/ask questions
- Provide time for experts to share wisdom and discuss
- Work together to make discussions accessible to novices
(These will always be a work in progress and will be updated, clarified, or expanded as needed.)
Zoom Specific
- If comfortable, please keep video on so we can all see each other’s faces.
- OK to break in for quick, clarifying questions.
- Use Raise Hand feature for new topics or for more in-depth questions.
- Please stay muted if not speaking. (Host may mute you.)
- We are recording. Link will be posted on #sciware Slack.
- Please keep questions for the speaker in the Zoom chat.
Future Sessions
- Suggest topics and vote on options in #sciware Slack
Today’s agenda
- Intro
- Time
- Python
- Julia
- C/C++
Profiling Intro
Dylan Simon
Goal
- We always want everything to take less time
- Need a way to define “less”. And quantify “time”.
- It’s easy to figure out how much time something takes… right?

“Wall time”
- Useful baseline measure
- Can compare changes (algorithms, dependencies, architectures, anything…)
- What if it takes weeks? (Or milliseconds?)
- Wall time is a noisy measure (system, scheduling, filesystem, network overhead)
- Which parts take time?
Time units
- “Wall time” = time
- “CPU time” = cpu cores * time
- Multiple threads
- 1 core for 1 second + 8 cores for 5 seconds + 1 core for 2 seconds = 43 cpu seconds, 8 wall seconds
- “CPU hours”: cluster usage (allocated, may be idle), 130k cores = 1.1B cpu hours/year
- \( \frac{\textsf{CPU time}}{\textsf{Wall time}} = \textsf{\%CPU} \) (average number of cores used)
Profilers
- Tools to break down which parts of your code take time
- Program: entire run of executable
- Function: time how long each function takes, how many times
- Line of code
- Machine instruction
- Each of these might run multiple times
- total time, number of executions, average time/execution
Strategies
- Is this what I expected?
- Is this part running too many times?
- Do the counts make sense (think about loops, sanity check)?
- Are unexpected parts slow?
- Is this necessary?
- Can this be faster?
- Calculation has to take time…
Bite-sized pieces
- Break calculations into smaller pieces
- Smaller data sets, fewer iterations
- Profiling doesn’t require getting results, just running code
- Can use smaller profiling results to infer longer run times (multiply!)
- Code when observed… runs slower

Simple timing
Jeff Soules
Smallest and largest scales
timeutility – program timingtimeit(Python) – testing small Python snippets- Rest of session focuses on tools in the middle
time
- System utility installed in
/usr/bin/timeor/bin/time- NOT the same as
time(a shell built-in)
- NOT the same as
- Used to time whole program execution
- Reports
real,user,systimes - “The Beginning and End of profiling”
Calling time
- Use as
$ /usr/bin/time -p EXECUTABLE - Examples drawn from sciware repo
sciware/19_Profiling/python_example/
So on my laptop:
$ /usr/bin/time -p src/sciware/19_Profiling/python_example/simulation.py
What time shows
real= wall timeuser= time executing YOUR codesys= time in operating system callsreallikely isn’tuser + sys

What time doesn’t show
- Only measures your process, not child threads/processes
- Does not tell you why
- (More sophisticated tools exist to help with this)
Selected examples
- Startup cost for first run of Python interpreter
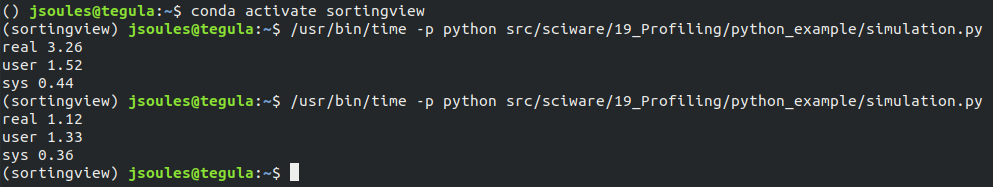
Selected examples
- Subprocesses not captured

- Workstation worse than laptop?

Understanding time
- Need to look at context!
- System load? (
htop!) - Hardware issues? (
iowait) - Memory? (garbage collection, swapping, cache…)
- Concurrency/system interactions? (network latency…)
- etc
- System load? (
- Complexity does not go away just because you put it in a black-box
timeit
- Python utility for testing small snippets of code
- Command-line or in-script use
- Runs small snippets until ~0.2 s has passed
- Smooths out statistical anomalies or startup costs
- Great for A/B testing, optimizing small decisions
How to timeit
- Command line:
python -m timeit 'print("Hello world!")' - From inside a script
- (See https://docs.python.org/3/library/timeit.html)
timeit output
- Number of times your code sample was run, per trial (
100000 loops) - Number of trials (5, because
best of 5) - The average speed per loop of the fastest trial (sec, msec, usec…)

A/B Testing
- Compare two versions of the same code
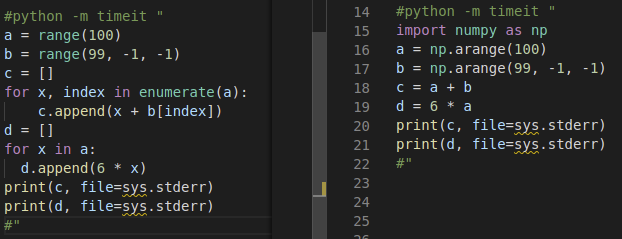
- Left version (loops): ~80 microsec/loop
- Right version (numpy): ~320 usec/loop
- Numpy’s not faster????
A
Vector manipuations with built-in arrays and explicit loops:
python -m timeit "
a = range(100)
b = range(99, -1, -1)
c = []
for x, index in enumerate(a):
  c.append(x + b[index])
d = []
for x in a:
  d.append(6 * x)
print(c, file=sys.stderr)
print(d, file=sys.stderr)
"
B
The same vector manipulations with numpy arrays:
python -m timeit "
import numpy as np
a = np.arange(100)
b = np.arange(99, -1, -1)
c = a + b
d = 6 * a
print(c, file=sys.stderr)
print(d, file=sys.stderr)
"
I/O Makes A Difference
...
print(d, file=sys.stderr)
" 2>/dev/null
- Suppress screen printing by adding
2>/dev/null- loop version now: ~30 usec/loop (down from 80)
- numpy version now: ~260 usec/loop (down from 320)
- I/O time is non-negligible! (Observation affects results)
Use Representative Data
- Increase the number ranges to 1 million instead of 100
- loop version now takes ~300 msec/loop (vs 30 usec)
- numpy version now takes ~3 msec/loop (vs 300 usec)
- numpy now 100x faster than loop
- Test cases need to be representative of data
Small Changes, Big Effects
- Remove the
printstatements entirely?- loop version now ~17 usec/loop
- numpy version now ~2 usec/loop (!)
- (Converting numpy arrays to strings is really expensive!)
Complexity Never Goes Away
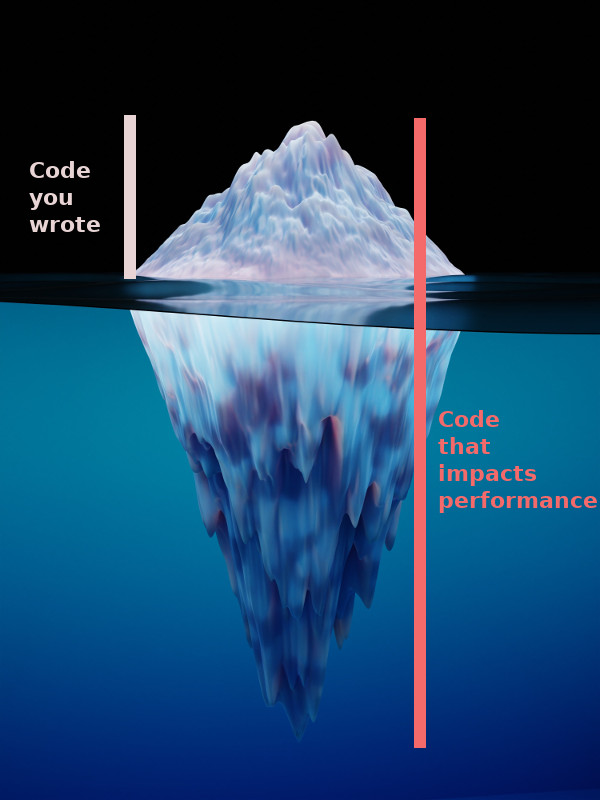
Complexity Never Goes Away
- Basic tools are useful but tricky
- Details count! (implementation & context)
- Next up: some tools that help dive into complexity
Python profiling
Robert Blackwell (SCC)
- Premature optimization is the root of all evil – Donald Knuth
Examples
- Example script is in
sciware/19_profiling/python_example/simulation.py - To follow along, you’ll
python3withnumpy,snakeviz, andline-profiler - A local display (or X forwarding) is needed for snakeviz, though this is a minor part
- Due to the nature of profiling, your results may vary significantly from your local machine and the cluster used in this presentation
- On an FI machine (or use conda/pip to install packages):
module load python
source ~rblackwell/envs/sciware_19/bin/activate
Python CPU profilers
Way too many to choose from, with different costs and benefits
- cProfile/profile (built-in and our focus today)
- line-profiler
- scalene
- pyFlame
- py-spy
- Palanteer
cProfile - a python staple
- Deterministic (hits every function)
- Typically moderate overhead
- No programmer setup cost - just works
- No full call stack information (hard to tell what called what)
- Great for a quick overview of where your program is spending time
Let’s try it out!
sciware/19_profiling/python_example/simulation.py
Julia profiling
James Smith (CCQ)
Examples
- All examples are in
sciware/19_profiling/julia_example - To follow along you’ll need Julia and the following Julia packages:
BenchmarkToolsPProfFlameGraphsFileIO
- You can install them by running
install_prereqs.jl
Using @time Pt. 1
- Array/Matrix/Tensor memory access matters
function copy_cols(x::Vector{Float64})
    n = size(x, 1)
    out = zeros(Float64, n, n)
    for i = 1:n
        out[:, i] = x
    end
    out
end
function copy_rows(x::Vector{Float64})
    n = size(x, 1)
    out = zeros(Float64, n, n)
    for i = 1:n
        out[i, :] = x
    end
    out
end
Using @time Pt. 2
- To run the comparison, we can do the following:
function main()
  N = Int(1e4)
  x = randn(N)

  println("Copying vector to columns")
  @time copy_cols(x)
  println("Copying vector to rows")
  @time copy_rows(x)
end
Using @time Pt. 3
➜  julia 01_timer.jl
Copying vector to columns
  0.354818 seconds (2 allocations: 762.939 MiB, 1.12% gc time)
Copying vector to rows
  1.033734 seconds (2 allocations: 762.939 MiB, 3.08% gc time)
Using @profile Pt. 1
function add_no_prealloc(x::Vector{Float64})
    x_new = x .+ 3.0
    return x_new
end
function add_prealloc!(x::Vector{Float64})
    x .+= 3.0
    nothing
end
Using @profile Pt. 2
- To run the comparison, we can do the following:
function main()
    x = zeros(10)

    println("\nShowing the profiling info")
    @profile (
        for i = 1:1e7
            add_no_prealloc(x)
            add_prealloc!(x)
        end
    )
    Profile.print(format = :tree, maxdepth = 12)

end
Using @profile Pt. 3
Showing the profiling info
Overhead ╎ [+additional indent] Count File:Line; Function
=========================================================
   ╎398 @Base/client.jl:495; _start()
   ╎ 398 @Base/client.jl:292; exec_options(opts::Base.JLOptions)
   ╎  398 @Base/Base.jl:418; include(mod::Module, _path::String)
   ╎   398 @Base/loading.jl:1253; _include(mapexpr::Function, mod::Module, _path::String)
   ╎    398 @Base/loading.jl:1196; include_string(mapexpr::typeof(identity), mod::Module, code::String, filename::String)
   ╎     398 @Base/boot.jl:373; eval
 12╎    ╎ 12  ...ojects/sciware/19_Profiling/julia_example/02_profiling.jl:5; add_no_prealloc(x::Vector{Float64})
  4╎    ╎ 4   ...ojects/sciware/19_Profiling/julia_example/02_profiling.jl:7; add_no_prealloc(x::Vector{Float64})
  1╎    ╎ 1   ...ojects/sciware/19_Profiling/julia_example/02_profiling.jl:10; add_prealloc!(x::Vector{Float64})
   ╎    ╎ 381 ...ojects/sciware/19_Profiling/julia_example/02_profiling.jl:38; main()
   ╎    ╎  381 ...k-src/usr/share/julia/stdlib/v1.7/Profile/src/Profile.jl:28; macro expansion
  7╎    ╎   332 ...jects/sciware/19_Profiling/julia_example/02_profiling.jl:40; macro expansion
  3╎    ╎    3   @Base/simdloop.jl:0; add_no_prealloc(x::Vector{Float64})
 10╎    ╎    10  ...jects/sciware/19_Profiling/julia_example/02_profiling.jl:5; add_no_prealloc(x::Vector{Float64})
   ╎    ╎    311 ...jects/sciware/19_Profiling/julia_example/02_profiling.jl:6; add_no_prealloc(x::Vector{Float64})
  1╎    ╎    1   ...jects/sciware/19_Profiling/julia_example/02_profiling.jl:7; add_no_prealloc(x::Vector{Float64})
  2╎    ╎   49  ...jects/sciware/19_Profiling/julia_example/02_profiling.jl:41; macro expansion
   ╎    ╎    41  ...ects/sciware/19_Profiling/julia_example/02_profiling.jl:11; add_prealloc!(x::Vector{Float64})
  6╎    ╎    6   ...ects/sciware/19_Profiling/julia_example/02_profiling.jl:12; add_prealloc!(x::Vector{Float64})
Total snapshots: 800
Using PProf Pt. 1
function complicated_func()
    # Pick parameters for our function
    p = [0.1, -0.5, 0.42, -3, 0.01, -0.2]
    n = 2000000

    # Setting up our data
    x = LinRange(0, 10, n)
    y = zeros(length(x))

    for i = 1:length(p)
        y .+= p[i] * x .^ i
    end

    # Add some noise
    y .+= rand(n) * 0.01

    # Setup X for solving
    X = zeros(Float64, (length(x), length(p)))
    for i = 1:length(p)
        X[:, i] = x .^ i
    end

    # Solve  Xβ=y
    β = X \ y
    error = (β - p) / norm(p)
    println("Relative error in coefficients ", error)
end
Using PProf Pt. 2
- Use
@profileto collect information about our function of interest (complicated_func()) - Save to a file
_03_profile_data.jlprof
function main()

    @profile complicated_func()
    Profile.print(format = :tree, maxdepth = 9)

    # Save the data for later
    save("_03_profile_data.jlprof", Profile.retrieve()...)

end
Using PProf Pt. 3
- Open the Julia REPL (like a shell)
- Load the data
- Using
pprof()to analyze the profiling data
julia> using PProf, FlameGraphs, FileIO
julia> data = load("_03_profile_data.jlprof")
julia> g = flamegraph(data[1]; lidict=data[2])
julia> pprof(g)
Using PProf Pt. 3
- Open the
PProfinterface in a browser (something like: http://localhost:57599)
Using PProf Pt. 4
- Now we can examine the lines one-by-one!

Julia Wrap-Up
- Check out the examples in the sciware repo for even more details!
C/C++ profiling
with gprof
Dylan Simon
Building
- Compile and link all files with
-g -pg - Better to disable optimization (no
-O) - Works with
gcc,g++,gfortran,clang,clang++
Running
- Run your program normally to produce
gmon.out GMON_OUT_PREFIX=foo ./myprogproducesfoo.PID- Program must not be killed/crash
- Analyze with:
gprof myprog gmon.out
Example
- Two implementations of a table (selected by
#define):- Dense array
- Sparse
unordered_map
Takeaways
- Only functions compiled with profiling included in report, timing
- Consider memory vs. time tradeoffs
- Sometimes using more memory can allow faster approaches
- (Our nodes have a lot of memory)
Alternatives
- oprofile (full system)
- vtune (processor stats, Sciware 2020-Jun-18 recording)
- …
- what do you use?